History of
Maximum Permissible
Interest Rate (MPIR)
MPIR Interest Rate History
History of Maximum Permissible Interest Rate (MPIR)
Historical MPIR Rates
The Maximum Permissible Interest Rate (MPIR) is the interest rate used to calculate the Daily Accommodation Payment (DAP) on a Refundable Accommodation Deposit (RAD).
The tables below list each MPIR period from 2006 to the current quarter.
To see how a RAD, DAP and the MPIR work together, read our guide to RAD, DAP and MPIR explained, or see the current nursing home fees and charges.
Understanding the History of the MPIR
The Maximum Permissible Interest Rate (MPIR) is the rate used to convert a Refundable Accommodation Deposit (RAD) into an equivalent Daily Accommodation Payment (DAP). The calculation is simple: RAD x MPIR ÷ 365 gives the daily amount. Because the MPIR moves with the broader interest rate environment, its history shows how the cost of choosing a DAP has changed over time.
2006 to 2009: High rates and a peak
In mid-2006 the MPIR was 9.87%. It climbed steadily through 2007, reaching 10.75% by the end of that year. It peaked at 11.75% in July to September 2008, just as the global financial crisis took hold. When the crisis drove interest rates down, the MPIR fell quickly, to 8.76% in early 2009 and 7.13% by mid-2009.
2010 to 2016: Recovery, then a long decline
The rate rebounded to 9.02% in early 2011, then began a long, gradual fall. It dropped to 8.62% in early 2012 and 7.24% in early 2013, and settled at around 6.6% through 2013 and 2014. By the end of 2016 it had eased to 5.76%.
2017 to 2021: Stability, then record lows
For most of 2017 to 2019 the MPIR held in a narrow band between about 5.7% and 6%. It fell below 5% for the first time in late 2019 (4.98%) and then reached 4.01% in 2021, the lowest level in the series. During these years a DAP was relatively cheap compared with the RAD it replaced.
2022 to 2024: A sharp reversal
As interest rates rose, so did the MPIR. It moved from 4.07% in April 2022 to 6.31% by the end of that year, then to 7.06% in early 2023 and 8.38% in early 2024. In under two years the rate more than doubled.
2025 to today
The MPIR stayed between 8.34% and 8.42% through 2024 and early 2025, then eased to 7.61% from October 2025 to March 2026. It has since climbed again, to 8.51% for October to December 2026.
Why the MPIR history matters
A small change in the MPIR makes a real difference to what a resident pays.
On a $500,000 RAD:
- At 4.01% (2021), the DAP was about $54.93 per day.
- At 8.51% (October to December 2026), it is about $116.58 per day.
That is roughly $22,500 more per year for the same accommodation. The rate in force also affects how a RAD, a DAP or a combination of the two compares in cost, so the right choice can change from quarter to quarter.
The table below lists every MPIR period from 2006 to the current quarter. Because fee rules changed on 1 November 2025, we recommend getting independent financial advice before deciding how to pay for accommodation.
Our team can also explain the options in plain language.
Enquire Now
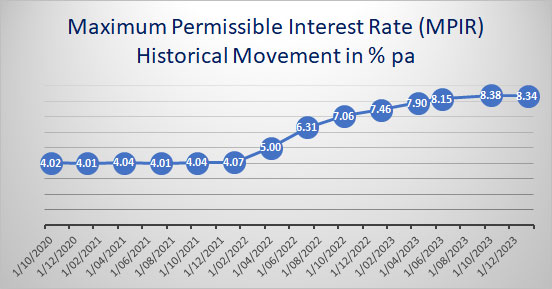
MPIR | 2017 to Current
| Period | MPIR |
|---|---|
| 1/10/2026 to 31/12/2026 | 8.51% |
| 1/07/2026 to 30/09/2026 | 8.43% |
| 1/04/2026 to 30/06/2026 | 7.96% |
| 1/01/2026 to 31/03/2026 | 7.61% |
| 1/10/2025 to 31/12/2025 | 7.61% |
| 1/07/2025 to 30/09/2025 | 7.78% |
| 1/04/2025 to 30/06/2025 | 8.17% |
| 1/01/2025 to 31/03/2025 | 8.42% |
| 1/07/2024 to 30/09/2024 | 8.36% |
| 1/04/2024 to 30/06/2024 | 8.34% |
| 1/01/2024 to 31/03/2024 | 8.38% |
| 1/10/2023 to 31/12/2023 | 8.15% |
| 1/07/2023 to 30/09/2023 | 7.90% |
| 1/04/2023 to 30/06/2023 | 7.46% |
| 1/01/2023 to 31/03/2023 | 7.06% |
| 1/10/2022 to 31/12/2022 | 6.31% |
| 1/07/2022 to 30/09/2022 | 5.00% |
| 1/04/2022 to 30/06/2022 | 4.07% |
| 1/01/2022 to 31/03/2022 | 4.04% |
| 1/10/2021 to 31/12/2021 | 4.01% |
| 1/07/2021 to 30/09/2021 | 4.04% |
| 1/04/2021 to 30/06/2021 | 4.01% |
| 1/01/2021 to 31/03/2021 | 4.02% |
| 1/07/2020 to 31/12/2020 | 4.10% |
| 1/04/2020 to 30/6/2020 | 4.89% |
| 1/01/2020 to 31/3/2020 | 4.91% |
| 1/10/2019 to 31/12/2019 | 4.98% |
| 1/08/2019 to 30/9/2019 | 5.54% |
| 1/07/2019 to 31/7/2019 | 5.54% |
| 1/04/2019 to 30/6/2019 | 5.96% |
| 1/01/2019 to 31/03/2019 | 5.94% |
| 1/10/2018 to 31/12/2018 | 5.96% |
| 1/07/2018 to 30/09/2018 | 5.96% |
| 1/04/2018 to 30/06/2018 | 5.77% |
| 1/01/2018 to 31/03/2018 | 5.72% |
| 1/10/2017 to 31/12/2017 | 5.70% |
| 1/07/2017 to 30/09/2017 | 5.73% |
| 1/04/2017 to 30/06/2017 | 5.78% |
| 1/01/2017 to 31/03/2017 | 5.76% |
MPIR | 2012 to 2016
| Period | MPIR |
|---|---|
| 1/10/2016 to 31/12/2016 | 5.76% |
| 1/07/2016 to 30/09/2016 | 6.01% |
| 1/04/2016 to 30/06/2016 | 6.28% |
| 1/01/2016 to 31/03/2016 | 6.22% |
| 1/10/2015 to 31/12/2015 | 6.14% |
| 1/07/2015 to 30/09/2015 | 6.15% |
| 1/04/2015 to 30/06/2015 | 6.36% |
| 1/01/2015 to 31/03/2015 | 6.75% |
| 1/10/2014 to 31/12/2014 | 6.63% |
| 1/07/2014 to 30/09/2014 | 6.69% |
| 1/04/2014 to 30/06/2014 | 6.63% |
| 1/01/2014 to 31/03/2014 | 6.59% |
| 1/12/2013 to 31/12/2013 | 6.60% |
| 1/10/2013 to 30/11/2013 | 6.60% |
| 1/07/2013 to 30/09/2013 | 6.82% |
| 1/04/2013 to 30/06/2013 | 6.95% |
| 1/01/2013 to 31/03/2013 | 7.24% |
| 1/10/2012 to 31/12/2012 | 7.62% |
| 1/07/2012 to 30/09/2012 | 7.66% |
| 1/04/2012 to 30/06/2012 | 8.37% |
| 1/01/2012 to 31/03/2012 | 8.62% |
MPIR | 2006 to 2011
| Period | MPIR |
|---|---|
| 1/10/2011 to 31/12/2011 | 8.86% |
| 1/07/2011 to 30/09/2011 | 9.00% |
| 1/04/2011 to 30/06/2011 | 8.92% |
| 1/01/2011 to 31/03/2011 | 9.02% |
| 1/10/2010 to 31/12/2010 | 8.74% |
| 1/07/2010 to 30/09/2010 | 8.80% |
| 1/04/2010 to 30/06/2010 | 8.16% |
| 1/01/2010 to 31/03/2010 | 7.95% |
| 1/10/2009 to 31/12/2009 | 7.30% |
| 1/07/2009 to 30/09/2009 | 7.13% |
| 1/04/2009 to 30/06/2009 | 7.16% |
| 1/01/2009 to 31/03/2009 | 8.76% |
| 17/11/2008 to 31/12/2008 | 11.31% |
| 1/10/2008 to 16/11/2008 | 11.31% |
| 1/07/2008 to 30/09/2008 | 11.75% |
| 1/04/2008 to 30/06/2008 | 11.69% |
| 1/01/2008 to 31/03/2008 | 11.15% |
| 1/10/2007 to 31/12/2007 | 10.75% |
| 1/07/2007 to 30/09/2007 | 10.37% |
| 1/04/2007 to 30/06/2007 | 10.37% |
| 1/01/2007 to 31/03/2007 | 10.37% |
| 1/10/2006 to 31/12/2006 | 10.19% |
| 1/07/2006 to 30/09/2006 | 9.87% |